Property prices around the world continue to soar, especially in global metropolitan hubs. From the luxurious avenues of Hong Kong to the towering skyscrapers of New York, owning a home in these cities is a symbol of wealth and status. Let’s dive into the top 10 most expensive cities to buy property in the world, and see how they compare with prices in Kuala Lumpur, Malaysia’s bustling capital.
Hong Kong

Average Price per Square Meter: USD 28,500 (Approx. RM 133,000)
Hong Kong consistently tops the list, with its limited land supply and high demand driving prices sky-high. Luxury apartments in prime areas like The Peak or Central can cost millions for a relatively small space.
New York City, USA

Average Price per Square Meter: USD 18,000 (Approx. RM 84,000)
Manhattan remains one of the priciest real estate markets globally. Prestigious addresses in areas like Tribeca or the Upper East Side command jaw-dropping prices, particularly for penthouses with skyline views.
London, UK

Average Price per Square Meter: USD 17,000 (Approx. RM 79,000)
London’s prime districts, such as Knightsbridge and Mayfair, are renowned for their historic properties and exclusivity. Brexit and economic uncertainty have moderated growth slightly but haven’t lowered the price tags.
Tokyo, Japan

Average Price per Square Meter: USD 16,000 (Approx. RM 75,000)
Tokyo’s property market blends modern apartments and traditional houses. Prime areas like Minato and Shibuya remain in high demand, especially with limited available land.
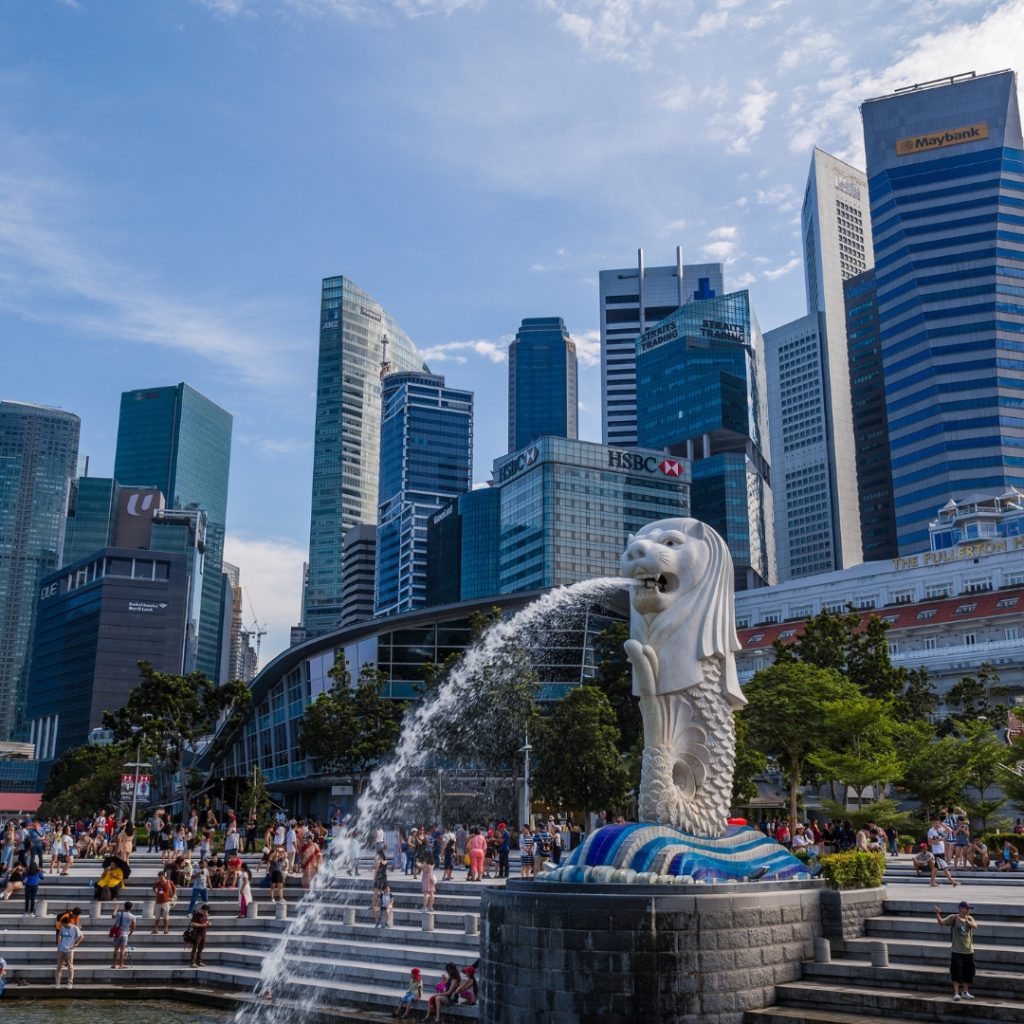
Singapore

Average Price per Square Meter: USD 15,000 (Approx. RM 70,000)
Singapore’s reputation as a global business hub attracts wealthy investors. Residential properties, particularly in districts like Orchard Road and Sentosa Cove, remain sought-after and premium-priced.
Paris, France

Average Price per Square Meter: USD 14,500 (Approx. RM 67,000)
Living in the City of Light doesn’t come cheap. Apartments in central areas like the Champs-Élysées and Saint-Germain-des-Prés reflect their cultural and architectural significance.
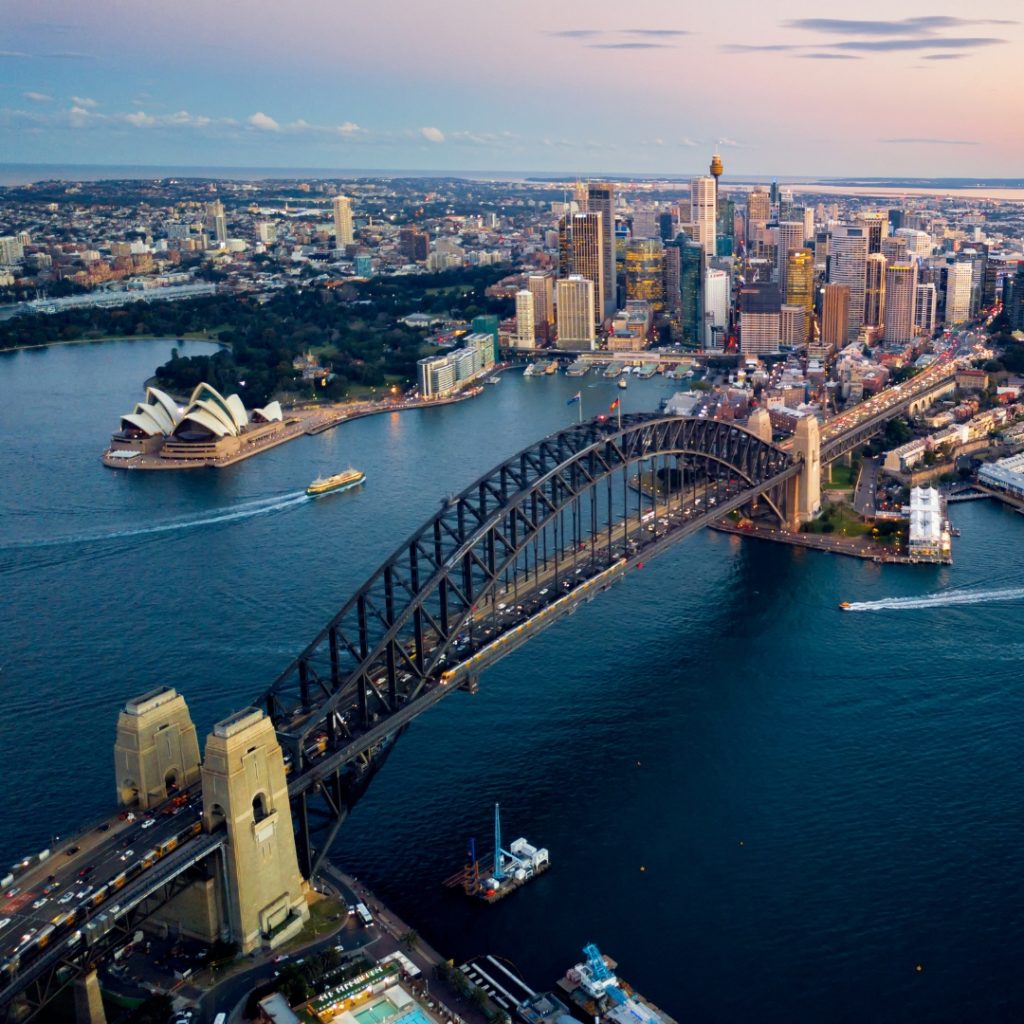
Sydney, Australia

Average Price per Square Meter: USD 13,800 (Approx. RM 64,000)
Sydney’s harborside locations and desirable climate make its property market highly competitive. Suburbs like Mosman and Double Bay command premium prices.
San Francisco, USA

Average Price per Square Meter: USD 13,500 (Approx. RM 63,000)
The tech boom has fueled San Francisco’s skyrocketing property market, especially in neighborhoods like Pacific Heights. Affordability remains a challenge for many locals.
Shanghai, China

Average Price per Square Meter: USD 13,000 (Approx. RM 60,000)
Shanghai’s modern skyline is a magnet for investors. Properties in the Bund and Pudong areas are priced at a premium due to their prime locations and luxurious amenities.
Geneva, Switzerland

Average Price per Square Meter: USD 12,500 (Approx. RM 58,000)
Geneva’s exclusivity and high living standards attract the world’s elite. The city offers lakeside mansions and apartments that reflect Swiss luxury and precision.
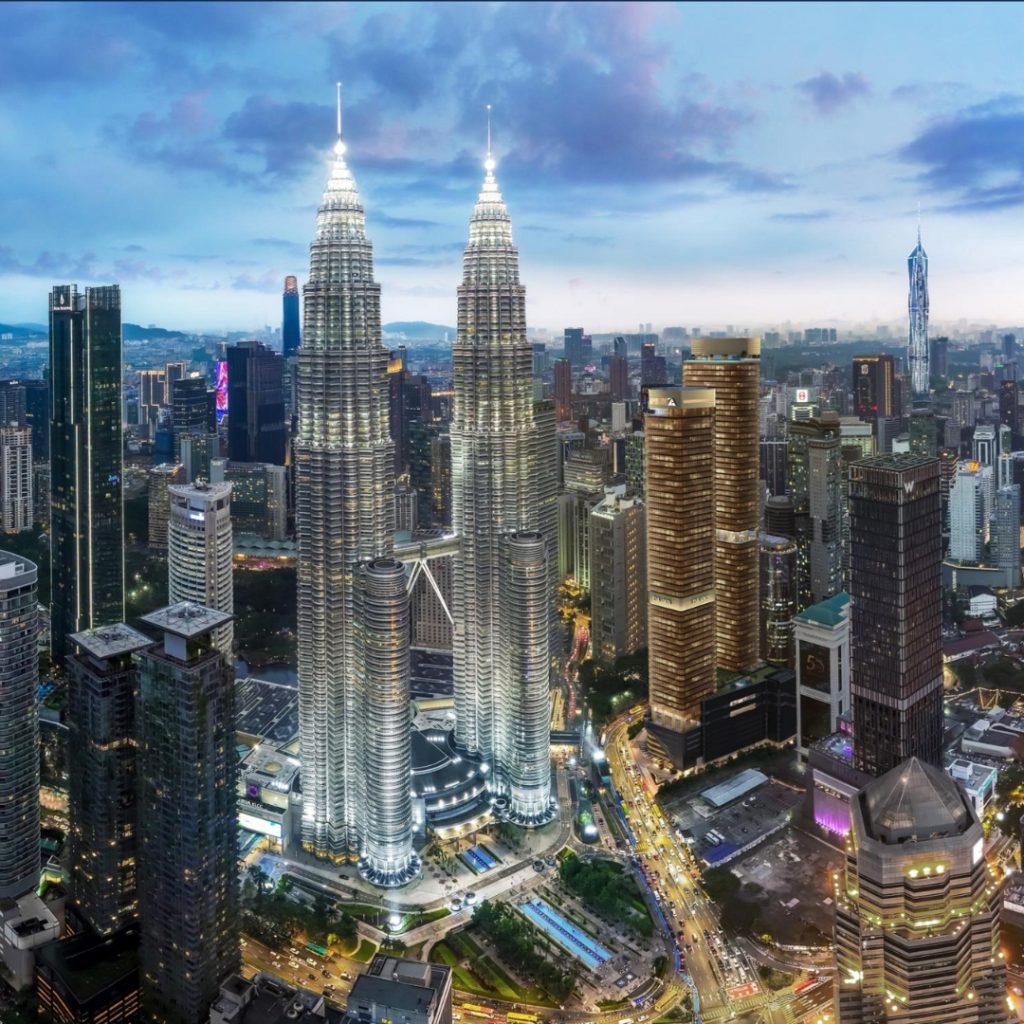
How Does Kuala Lumpur Compare?

Average Price per Square Meter: USD 3,500 (Approx. RM 16,000)
Compared to these global heavyweights, Kuala Lumpur remains relatively affordable. Prime areas like the KLCC vicinity or Mont Kiara offer modern high-rise living at a fraction of the cost. This affordability, combined with the city’s growing infrastructure and economic potential, makes KL an attractive option for both local and international investors.
Key Takeaway
Investing in real estate is always about location, and the world’s most expensive cities reflect their unique economic and cultural dynamics. While Kuala Lumpur offers incredible value in comparison, cities like Hong Kong and New York continue to dominate due to their global significance and limited availability of prime properties.
Source: The property prices quoted in this article are based on general trends and averages reported by reputable global real estate market analyses, including Knight Frank’s Global Residential Cities Index, CBRE’s Global Living Report, and Numbeo’s Property Price Index. These sources aggregate data from real estate agencies, government statistics, and property market surveys to provide a comprehensive view of average price ranges for major global cities. All pricing information is accurate as of August 2024 and may be subject to change due to market fluctuations and other economic factors. Readers are encouraged to conduct further research or consult with real estate professionals for the most up-to-date information.


